In the month of April, Australian capital city home values (including all houses and units) rose by just 0.2 per cent, which is the lowest monthly growth rate RP Data-Rismark have recorded since the end of the GFC-induced downturn in December 2008. On a seasonally-adjusted basis,* Australian capital city home values advanced by 0.3 per cent.**
All the capital city growth rates recorded in the month of April were substantially less than the national average of one per cent per month over the previous year. Indeed, Melbourne’s monthly growth rate of 0.8 per cent in April was half the 1.6 per cent per month average in the year to March.
When we divide RP Data-Rismark’s patented hedonic index up according to the bottom 20 per cent of all capital city suburbs ranked by price, the middle 60 per cent, and the top 20 per cent, we find evidence of a clear moderation in capital growth rates across all price strata (see first chart below). And while the most expensive suburbs have outperformed the more affordable markets since the start of 2009 (refer to the top line), these areas experienced a 0.6 per cent contraction in value in April.
Here it is also worthwhile noting that whereas the cheapest suburbs led Australia’s housing recovery at the end of 2008 before homes in other price bands, these regions now look to be the first to have experienced an attenuation in growth rates (refer to lower line in the chart below). In fact, the cheapest suburbs have recorded almost half the house price growth realised by the mid and upper markets in 2010. This is a dynamic that the Governor of the RBA presciently referred to late last year.

Rismark has been forecasting a cooling in house price growth back to single digit levels since October 2009. With the benefit of hindsight, the 11.8 per cent rise in the cost of Australian housing evidenced in 2009 should not have been all that surprising. Overall disposable household incomes rose by a near identical 11.5 per cent as a consequence of the government’s fiscal stimulus and a multi-decade interest rate nadir.
In the current calendar year most economists project that disposable household income growth will be a comparatively weaker 3-5 per cent. Rismark’s national ‘dwelling price-to-income ratio’ index shows that since 1993 Australian residential property values have tracked purchasing power quite closely (the latest estimate of this ratio is 4.7 times). 2010 will likely be no different. When thinking about these relationships, it also pays to remember that the income characteristics of the marginal home buyer and/or capital city borrower can be different to those attributable to national averages reported in the ABS National Accounts, which include the circa 30 per cent of households that do not own a home, and borrowers living in non-capital city markets.
Since the start of 2007 housing costs in Australia’s capital cities have risen more rapidly than the ‘rest of state’ markets, which, while frequently ignored by the media, still account for around 40 per cent of all homes. This is presumably attributable to the confluence of stronger demand and less responsive supply in metro areas.
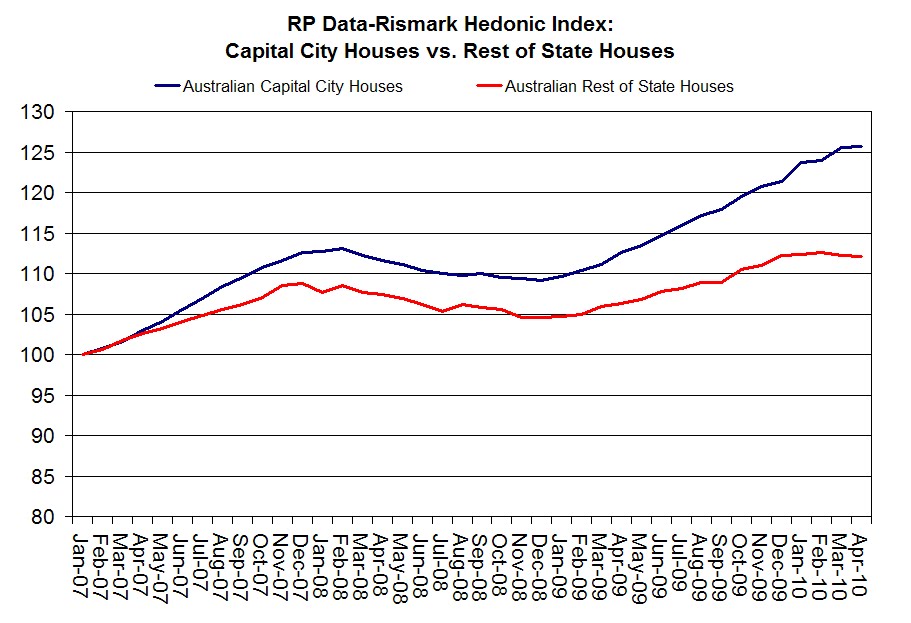
On a seasonally-adjusted basis, house values in the ‘rest of state’ areas have not increased at all in 2010, registering a decline of -0.1 per cent over the first four months of the year.*** And in the 12 months to April 2010 house values in the rest of state regions have appreciated by just 5.6 per cent (or less than half the rate of their capital city counterparts). The chart below shows the monthly growth rates in the capital city and non-capital city markets since the start of 2010.

The principal driver of the downdraught in Australian house price inflation has been the recalibration of monetary policy. The headline variable mortgage rate hit a trough of 5.75 per cent in May 2009. After watching the near-term effects of the GFC subside, the RBA has lifted the cost of housing credit back to 7.4 per cent, which is almost exactly in line with the long-term historical average since the central bank embraced its inflation-targeting regime in the early-to-mid 1990s. This is still, however, well down on the 9-10 per cent mortgage rates Australian borrowers faced as recently as August 2008.
In May the RBA’s head of financial system stability, Dr Luci Ellis, claimed in a major speech on Australia’s housing market that “we do not have a credit-fuelled speculative boom on our hands.” This verified what we had been arguing for many months about both the RBA’s views on the burgeoning recovery, and the influences in the market more generally. The short story is that the escalation in housing costs has been mainly motivated by underlying demand- and supply-side fundamentals, not leverage as some doomsayers would have us believe.
Five findings in the RBA’s latest Financial Stability Review bear this out: first, housing credit growth remains very modest and nearly half its average rate over the last 15 years; second, total household gearing in Australia is about 29 per cent and less than half the leverage that currently exists in the US; third, Australia’s mortgage default rates are about one-tenth and one-quarter their US and UK equivalents notwithstanding our substantially higher home loan rates; fourth, the proportion of all borrowers that suffer from a conjunction of high loan-to-value ratios and large repayment burdens is very small (roughly two per cent); and, finally, Australian banks have consistently applied conservative credit assessment standards.
RP Data-Rismark’s April index results are important insofar as they offer the first credible evidence of a genuine moderation in house price growth. Some will no doubt chalk this up as a victory for the RBA’s recent ‘jawboning’ of the purported ebullience. Although there may be some truth in this, the RBA’s ‘open mouth operations’ have also caused considerable confusion amongst lenders and developers as to whether it believes the market is experiencing a ‘bubble’. Fortunately, Dr Luci Ellis’ recent speech on the subject righted several misunderstandings in this regard.
Dr Ellis also highlighted the fact that housing markets and the household sector have not historically been a source of ‘system stability risk’ despite some media commentators’ apparent obsession with convincing us of this. The far more hazardous areas of the economy have been government, corporates and commercial real estate. Or, in Dr Ellis’ words:
“Compared with other kinds of credit, lending to households to finance the purchase of housing is relatively low risk. International banking regulations recognise this by applying lower risk weights to home mortgages than to small business loans… Historically, households have not normally been the instigators of financial instability. Aside from the current episode in the United States, financial crises are normally sparked by other sources. These include commercial property, property development, leveraged buy-outs, sovereign debt and so on.”
* Last month RP Data-Rismark launched Australia’s first ‘seasonally-adjusted’ house price index. Rismark’s analysis shows that Australia’s housing market exhibits strong seasonality.
**March’s 1.4 per cent capital growth estimate has been slightly revised to 1.3 per cent based on more recent sales.
**After receiving a request from the RBA, Rismark and RP Data recently established a non-capital city or ‘rest of state’ house price index using our patented hedonic technology.