What is risk? The prospect of not meeting your investment objectives and/or losing money. Want to see an example of extreme risk? Take an exceptionally well-diversified portfolio of the 200 largest companies listed on the ASX. This is what that portfolio's daily returns look like (first chart). I will repeat again: these are daily changes in the value of the portfolio.
How can we measure risk? One way is to estimate the amount by which the returns vary, or move around. This is sometimes represented by a concept known as "volatility" or "standard deviation". This tells how much the returns of an investment are likely to vary from its "average" return over a given period of time. Low volatility means the returns are very stable and bunched tightly together. Higher volatility means returns fan out more from the average return--you see high or low outcomes more frequently.
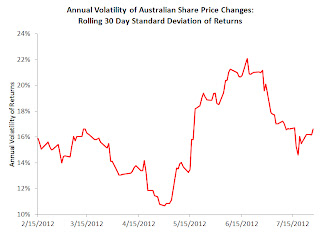
Over the last 30 years, the annual volatility of the returns provided by, say, Australian bank bills has been less than 2%. That is, ultra stable. A portfolio of fixed-rate, 10 year Australian government bonds has had more volatility at about 8-9% per annum. This is because with a fixed-rate, as opposed to variable-rate, bond you take a lot of market interest rate risk. The second chart below shows the volatility of the daily returns generated by the top 200 companies listed on the ASX in 2012.
Real-time, stream-of-consciousness insights on financial markets, economics, policy, housing, politics, and anything else that captures my interest. Tweet @cjoye
The author has been described by News Ltd as an "iconoclast", "Svengali", a pollie's "economist muse", and "pungently accurate". Fairfax says he is a "Renaissance man" and "one of Australia’s most respected analysts." Stephen Koukoulas concludes that he is "85% right", and "would make a great Opposition leader." Terry McCrann claims the author thinks "‘nuance’ is a trendy village in the south of France", but can be "scintillating" when he thinks "clearly". The ACTU reckons he’s "an enigma wrapped in a Bloomberg terminal, wrapped in some apparently well-honed abs."

