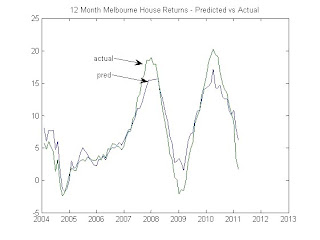
In late 2009 Rismark repeatedly forecast that the double-digit house price growth registered over that year would fall back to single-digit levels in 2010 in line with expected disposable household income growth of 3-5 per cent (see here for the records). As it turned out, house prices rose by about 5 per cent last year.
In September 2010, a couple of months prior to the RBA’s de facto double rate hike, I commented, “Since 1993 there have been five instances when the RBA has lifted the cash rate sharply. On every single occasion national capital city dwelling prices have flat-lined or declined. If the RBA aggressively raises rates, there is no reason to expect 2010-11 to be any different.”
Two months later, I further warned that, “[O]ur central case is that there will be little-to-no nominal dwelling price growth over 2011, with a chance of small nominal declines.”
In the first two charts below, I have illustrated how Rismark’s 'out-of-sample' (ie, blind) forecasts for Australia’s two biggest cities have stacked-up against actual house price movements over the last few years.
RP Data-Rismark’s April index results very much confirm our 2010 projections. In short, the RBA’s ‘double-tap’ in November has started to bite, with the luxury end of the market leading the way.
Raw house prices have retraced slightly by 0.7 per cent over the first four months of 2010. To put that in perspective, that’s similar to the daily movements one sees in the Australian sharemarket index.
In seasonally-adjusted terms, which allows one to strip out the periodic, intra-year seasonal shifts in house prices, dwelling values are down a far more noticeable 2.5 per cent.
The difference between these two results reflects the fact that the housing market normally realises above-trend growth at the start of each year.
As I have explained here, the RBA explicitly asked us to report seasonally-adjusted index results in addition to the raw numbers, which is what economists and statisticians also prefer.
There are two interesting insights to be drawn from RP Data-Rismark’s latest release. First, the rather unexciting overall market conditions conceal some more striking cross-sectional dynamics. The chart below shows the movements in home values over the 12 months to end April.
Observe the circa 7 per cent corrections in the value of housing in Perth and Brisbane, which contrasts against the rest of the nation where house prices range from being up 1.2 per cent to down 2.9 per cent, depending on the city you look at. This is consistent with the ramp-up in repossessions that the RBA has documented in Queensland and Western Australia since the GFC, although repo's seem to be declining again (see here for the RBA's repo data).
Notwithstanding the absence of capital gains, rents have been growing relatively quickly, with apartments now yielding 4.9 per cent gross. We saw that in the first quarter of 2011 the ABS also reported that rents rose by 1.3 per cent, significantly outpacing core inflation.
The second finding of interest is the rapid deceleration in the luxury home segment.
Following a request by the RBA, RP Data and Rismark divided our capital city house price index into three sub-indices: the bottom 20 per cent of suburbs ranked by price, the middle 60 per cent, and the top 20 per cent.
Over the year to end April, dwellings in the most expensive capital city suburbs recorded a 5.4 per cent loss (see next chart). In contrast, home values in the middle 60 per cent of suburbs were down by only 0.9 per cent. Dwellings located in the cheapest 20 per cent of suburbs were the best performers (-0.5 per cent).
The uber-luxury segment is risky and highly illiquid, and has had the rug whipped from under it via a combination of the soaring Aussie dollar and the enormous destruction of wealth in Australia’s volatile sharemarket.
A final fly in the ointment is the much lower growth—and pay packets—expected in the financial services industry going forward. Luxury homes in areas like Sydney’s Eastern Suburbs will continue to face valuation headwinds as banks deal with the new normal of subdued credit growth.
Real-time, stream-of-consciousness insights on financial markets, economics, policy, housing, politics, and anything else that captures my interest. Tweet @cjoye
The author has been described by News Ltd as an "iconoclast", "Svengali", a pollie's "economist muse", and "pungently accurate". Fairfax says he is a "Renaissance man" and "one of Australia’s most respected analysts." Stephen Koukoulas concludes that he is "85% right", and "would make a great Opposition leader." Terry McCrann claims the author thinks "‘nuance’ is a trendy village in the south of France", but can be "scintillating" when he thinks "clearly". The ACTU reckons he’s "an enigma wrapped in a Bloomberg terminal, wrapped in some apparently well-honed abs."


