The June outcome follows on from a clear trend in the decline in monthly seasonally-adjusted growth rates in Australia’s capital cities over February (+1.0%), March (+0.9%), April (+0.6%) and May (+0.3%).
Despite the strong ‘seasonality’ in house price data, RP Data–Rismark is the only index provider to provide seasonally-adjusted results, which is the RBA’s preferred approach.
Over the June quarter, Australian dwelling values were flat with effectively no growth (+0.1 per cent in seasonally-adjusted terms). This represents a striking deceleration in the quarterly rate of increase in home values. Since the start of 2009, the average quarterly capital growth realised by dwellings located in Australia’s capital cities has been 3.0 per cent (seasonally-adjusted).
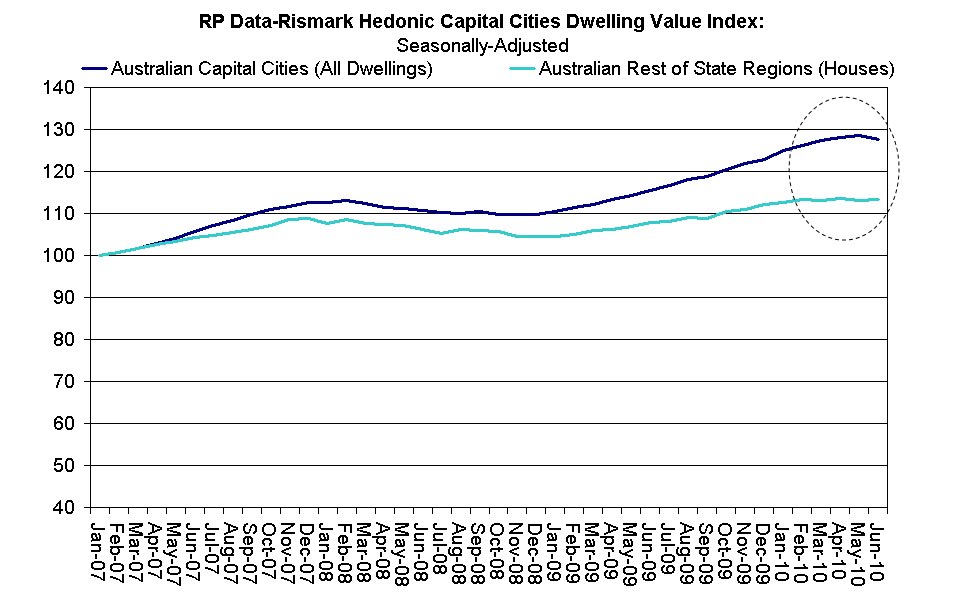
The second quarter housing market freeze has been evident in both the capital city and ‘rest of state’ markets, which account for about 40 per cent of all dwellings by number. RP Data-Rismark’s ‘Rest of State’ Hedonic Index, which was developed for the RBA, registered virtually no capital growth in the June quarter (+0.3 per cent seasonally-adjusted) and a very modest 5.2 per cent rise over the year to June 2010. This is less than half the 10.5 per cent annual growth recorded in Australia’s capital cities in the 12 months to end June (see chart).
The soft-landing in Australia’s housing market—which had been long anticipated by Rismark—after last year’s double-digit capital gains has been pervasive across all price cohorts. The cheapest 20 per cent of suburbs, middle 60 per cent of suburbs, and most expensive 20 per cent of suburbs (ranked by price) all fell in value in the month of June. The slow-down has been led by homes in the luxury markets, which have tapered by 1.9 per cent since March 2010 (see chart).

This will be manna from heaven for the housing market bears and follows news that the ASX will soon provide investors with an opportunity to both go ‘long’ or ‘short’ Australian house price indices.*
RP Data–Rismark’s Hedonic Index is based on Australia’s largest home sales database, which captured nearly 170,000 sales in the six months to June. This index is referenced by the RBA in its Statement on Monetary Policy and was the first to report the strong rebound in Australia’s housing market at the start of 2009. It was also the first to signal the onset of a slow-down in growth in April 2010. The RBA has referred to this monthly deceleration in its recent Board minutes.
Unlike other measures, RP Data–Rismark’s Hedonic index is reported on a monthly basis and does not average through the quarter. When there are turning points in the housing cycle, ‘quarterly’ house price indices, such as that published by the ABS, clearly lag RP Data–Rismark’s month-on-month measure.**
As a result of the housing market’s cooling in the June quarter, the year-on-year capital growth rate has fallen from 13.6 per cent in the 12 months to March 2010 to 10.5 per cent in the year to June 2010 (seasonally-adjusted).
In the June quarter, all capital cities experienced virtually no or negative growth with the exception of Adelaide where dwelling values rose by a respectable 1.1 per cent. Adelaide also happens to be the cheapest capital city outside of Hobart with a median dwelling price of just $390,000, which is 16 per cent less than the median dwelling price in Australia’s capital cities of $465,000. It is useful to note here that the median dwelling price across all Australian regions is a much lower $415,000.
Dwellings in Sydney (+0.5 per cent), Melbourne (+0.2 per cent), Brisbane (-1.3 per cent), Perth (-2.5 per cent), Darwin (-0.1 per cent) and Canberra (-0.8 per cent) all experienced a marked reduction in growth rates in the June quarter from the 3 per cent per quarter pace witnessed since the beginning of 2009.
Rismark had been forecasting a substantial deceleration in housing conditions back to single-digit annualised growth rates since October 2009. Over the long-run, house prices track purchasing power quite closely. Disposable household incomes were only projected to rise by about 5 per cent in 2010. We’ve had 4.7 per cent growth in dwelling values in the year-to-date. We do not, therefore, expect to see the market rise much further over the remaining year subject to labour market conditions and the course of monetary policy.
As mortgage rates have normalised, participants in the housing market also have cut their growth expectations, which helps explains the current change in conditions. This was reflected in survey data released by NAB yesterday. According to NAB, consumers have slashed their expectations of house price growth over the next 12 months from 5.2 per cent in March to just 1.4 per cent in June.
It’s sobering to remember here that we have had 17 consecutive monthly increases in Australian capital city home values. If the sharemarket rose for 17 months straight and then tapered, people would not think twice. It might be wise to apply the same logic to our housing market.
*If you want to find about more about house price hedging opportunities, please email an inquiry to info@rismark.com.au
** RP Data–Rismark privately compute a “stratified median price index” like that used by the ABS and others (we also estimate the two different Case-Shiller and FHFA repeat-sales models). When calculating a quarterly stratified median price index, RP Data–Rismark have been able to confirm that growth rates can be spuriously higher than the monthly hedonic measure due to the higher weight applied to the earlier months in the quarter (ie, April and May) that have more sales data.