The first is an outstanding little research note by Paul Bloxham et al on the relationship between house prices, turnover and housing finance. This is a valuable contribution to the existing knowledge base. The second is Ric Battellino's speech today, which is also well worth a read for those interested in household debt. Here is an excerpt of the latter:
"The current household debt ratio in Australia is similar to that in most developed countries (Graph 2).1 Significant exceptions are Germany and France, where the ratios are lower, at around one year’s income, and the Netherlands, where the ratio is much higher – almost 2½ years’ income – due to the tax incentives for households to stay geared up.
All countries have experienced rises in household debt ratios over recent decades. Clearly, therefore, the forces that drove the rise in household debt ratios were not unique to Australia. The two biggest contributing factors were financial deregulation and the structural decline in interest rates.
One of the consequences of financial deregulation was that the availability of credit to households greatly increased. Up to the 1980s, the various controls on the financial sector meant that the ability of households to obtain credit was constrained. Even obtaining a housing loan was relatively difficult. However, after financial regulations were eased around the globe, many new financial products were developed specifically for households, and particularly relating to housing finance. Households found it was much easier to get a loan. Most loans products have worked well, though some have caused significant problems; sub-prime loans in the United States are the clearest example.
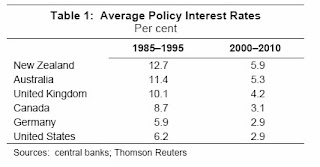
The level of interest rates in most developed economies in the past decade has been about half that in the decade to 1995. This structural decline in interest rates has facilitated the increase in household debt ratios because it reduced debt-servicing costs (Table 1). Households have therefore found that they can now service more debt than used to be the case.
First, at the same time as the household debt ratio has risen, so too have the assets held by households. Some commentators might dismiss this as simply reflecting the fact that the additional debt has been used to inflate asset values. There is some basis for this in relation to housing assets but, even if we exclude housing and focus only on households’ financial assets, the statement is still true. Financial assets held by households have risen to the equivalent of 2.75 years of household income, up from 1.75 years’ income in the early 1990s.
Second, the available data suggest that the increased debt has mostly been taken on by households which are in the strongest position to service it. For example, if we look at the distribution of debt by income, we can see that the big increases in household debt over the past decade have been at the high end of the income distribution (Graph 3). Households in the top two income quintiles account for 75 percent of all outstanding household debt (Graph 4). In contrast, households in the bottom two income quintiles account for only 10 per cent of household debt.
If we look at the distribution of debt by age of household, we see that the increased debt has mainly been taken on by middle-aged households. The proportion of 35– 65 year olds with debt increased significantly through to 2008, as households have been more inclined to trade up to bigger or better located houses, and to buy investment properties. Households under 35 years of age (i.e. the group that would typically encompass first-home owners), in contrast, have seen a fall in the proportion with debt (Graph 5).
Another factor that has contributed to the resilience of household finances is that, by and large, the debt has not been used to increase consumption. Apart from some brief periods, household consumption has not been unusually elevated during this period of rising debt. Rather, the debt has mainly been used to acquire assets.
Perhaps the best, and most direct, indicator of households’ capacity to support the increase in debt is the arrears rates on loans. This remains very low in Australia. The current arrears rate is around 0.7 per cent. This is one of the lowest rates among developed economies (Graph 6). Other data also suggest that households’ aggregate debt-servicing capacity is quite strong: in recent years more than half of owner-occupiers have been ahead of schedule on the repayments on the loan they took out to buy their property."
Real-time, stream-of-consciousness insights on financial markets, economics, policy, housing, politics, and anything else that captures my interest. Tweet @cjoye
The author has been described by News Ltd as an "iconoclast", "Svengali", a pollie's "economist muse", and "pungently accurate". Fairfax says he is a "Renaissance man" and "one of Australia’s most respected analysts." Stephen Koukoulas concludes that he is "85% right", and "would make a great Opposition leader." Terry McCrann claims the author thinks "‘nuance’ is a trendy village in the south of France", but can be "scintillating" when he thinks "clearly". The ACTU reckons he’s "an enigma wrapped in a Bloomberg terminal, wrapped in some apparently well-honed abs."

