The author has been described by News Ltd as an "iconoclast", "Svengali", a pollie's "economist muse", and "pungently accurate". Fairfax says he is a "Renaissance man" and "one of Australia’s most respected analysts." Stephen Koukoulas concludes that he is "85% right", and "would make a great Opposition leader." Terry McCrann claims the author thinks "‘nuance’ is a trendy village in the south of France", but can be "scintillating" when he thinks "clearly". The ACTU reckons he’s "an enigma wrapped in a Bloomberg terminal, wrapped in some apparently well-honed abs."

Sunday, August 1, 2010

Amazing story of declining Australian housing credit growth. Now at all-time lows

I have quickly pulled together this chart from the RBA's latest credit aggregates stats, which were released last week. On a six monthly annualised basis, growth in outstanding housing credit has been just 7.6%, which is near its all-time lows since 1990. What explains this? And what explains the consistent decline in the growth of Australian housing credit (outstanding) since its recent peak of 14.4% in July 2006? And why have we had periods of high (and low) house price growth during this time of apparently falling credit growth? All good questions, which can be explained by a--sometimes conflicting--combination of:

1) Fundamentally-driven housing demand (eg, population growth and rising disposable household incomes);
2) Borrowers paying down debt more quickly than they have in the past;
3) During the GFC, first time buyers taking out smaller loan balances to buy cheaper homes;
4) Generally higher interest rates since 2006 (with the exception of a short period during the GFC, which was likely negated by the first time buyer effects) resulting in higher interest repayment burdens and less principal reduction in the early years of a loan;
5) A reduction in the latent pool of available credit due to the demise of securitisation markets and second tier lenders' funding challenges; and
6) A substantial tightening of credit standards (eg, reduced LVRs) following the GFC.

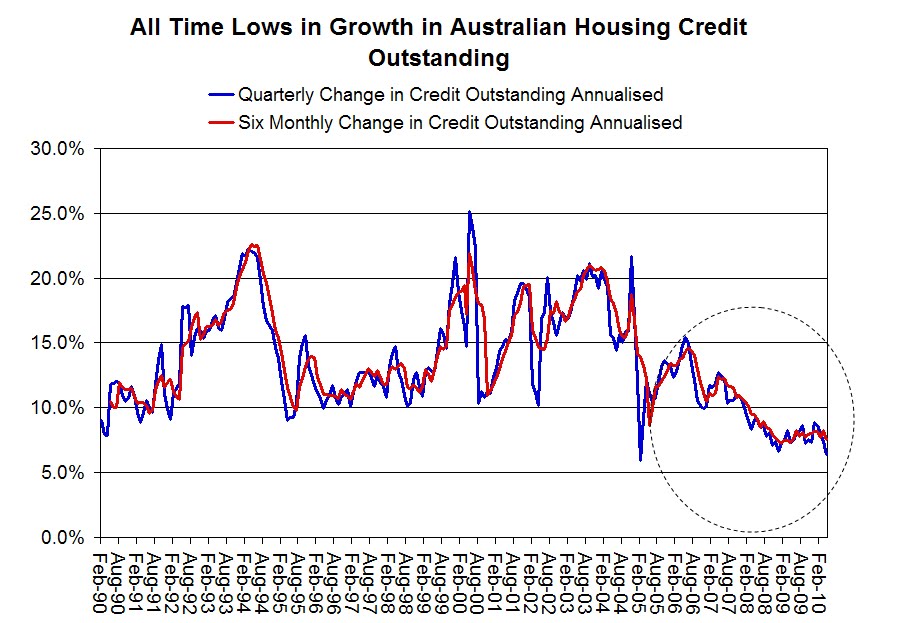
Of course, it is near impossible to disentangle all these effects. But check out the chart below.