Applying empirical analysis over the last 30 years across all asset-classes we have shown that it is next to impossible to justify the 50-60 per cent portfolio weights to Australian and international shares that most super funds make. This is a function of both the very high probability of loss associated with equities, and the fact that Australian and international shares (and LPTs for that matter) are highly correlated with one another (ie, there is little-to-no diversification benefit treating them as separate investment classes).
The key take-away here is simply that these decisions expose members to unnecessary risks, which is why immediately post the GFC the average default super fund had delivered negative returns over the prior 3 years, and had underperformed cash investments during the previous half decade. And while some argue that since equities outperform in raw return terms over the long-run you can look past their volatility, the fact is that timing does matter for most members.
After the cataclysmic 40-50 per cent losses seen in 1987 and 2007-09, it can take years for the equities market to recover its original values. It took around 9 years for the Australian All Ordinaries Index to consistently breach its September 1987 peak of 2,306pts after the 1987 stock market crash (see Figure 47).* And worryingly, it has now been over 2 years since the All Ordinaries Index reached its pre-GFC high of 6,854pts in November 2007. Today the index still sits more than 30 per cent below this peak (see Figure 48).

 (Click to enlarge)
On the basis of standard portfolio optimisation analysis we have illustrated that super funds could deliver members similar return outcomes with substantially lower risks if they recalibrated their asset-allocations (or, more technically put, their asset-allocation decisions tracked more closely to the “mean-variance efficient weights” that are outputted when optimising a portfolio across the last 30 years’ worth of asset-class data).
We were recently asked by a very senior member of the industry whether the results of our analysis, which was based on the period June 1982 to June 2009, were an artefact of these specific dates. For example, did the allocations to equities change significantly if one ran the analysis between June 1982 and, say, June 2007 (ie, just prior to the GFC)?
Regular readers will recall that these risk and return optimisations are standard tools used by institutional investors all around the world. They take the long-term risk (defined as the standard deviation of returns), return, and correlation characteristics of all relevant investment classes and provide one with the lowest possible risk combinations that yield an investor’s target return.
For the purposes of Australian investors, we have previously estimated cross asset-class portfolio optimisations over the last 27 years of data (viz,. June 1982 to June 2009). This time horizon was not a discretionary choice, but rather the longest period over which one can make objective comparisons across a wide range of investment categories. It also encapsulates numerous economic booms and busts.
Of course, the target portfolio return that one selects has a weighty influence on the assets in which you invest. The conclusions yielded by the optimisation as therefore sensitive to this variable. One of Australia’s leading asset consultants, Frontier Investment Consulting, recently disclosed that it has delivered a return of 3 per cent to 3.5 per cent above inflation for its clients over the last 12 years. Most ‘balanced’ and ‘growth’ super fund strategies target returns of CPI plus 3-5 per cent. The Future Fund is at the more aggressive end of the spectrum, and has an explicit target of 4.5-5.5 per cent above inflation in its legislated investment mandate.
The higher one’s return target, the greater the portfolio weight one will inevitably have to listed equities in order to achieve this objective since shares have generated the highest raw returns over the long-run (with, of course, commensurately higher risk).
To conservatively answer the question that was put to us regarding the sensitivity of the asset-allocation results to the time period selected, we made two specific changes to our earlier approach.
To entrench the conservatism of our analysis, we first constrained the methodology such that the portfolio combinations had to generate a very high long-term return target that would clearly favour equities investments. In particular, we selected a return target of CPI plus 6.5 per cent per annum, which, based on super fund standards today, would be classified as very high growth.
Second, instead of running a single optimisation over the period 1982 to 2009 we ran multiple optimisations on a year-by-year basis from 1982 to 1991, 1992, 1993 and so on through to 2009. Thus in contrast to the single 27 year period that we had employed in the past, which one might criticise as unfairly disadvantaging equities due to the recent GFC-induced downturn, this analysis provided us with 19 different optimisations with the end period starting in June 1991 and then rolling forward one year on 18 occasions until we hit June 2009. We selected 1991 as the first period in this analysis simply because it provides us with a minimum of 10 years worth of historical data (given the start date of June 1982).
The results are illustrated in Figure 49. Based on a real return target of CPI + 6.5 per cent, irrespective of which of the 19 different periods one chooses between 1991 and 2009 (taking the start date of 1982), the maximum total portfolio weight ever allocated to all listed equities (ie, Australian equities, international equities and LPTs) is just 27 per cent. Unsurprisingly, this occurred in June 2007 just prior to the advent of the GFC (and following a long bull market). The average total portfolio allocation to all equities-related investments between 1991 and 2009 is just 10 per cent.
Figure 50 depicts the optimal portfolio weights rank-ordered by year (ie, 1991 to 2009) with the associated portfolio risk outcomes illustrated on the x-axis. What is noteworthy here is just how much one can cut a super fund’s total portfolio risk to very low levels by getting asset-allocation right. Compare, for instance, the highest portfolio risk outcome, which is 3 per cent per annum in 2009, with the volatility of Australian and international shares, which are around 16-17 per cent per annum. And we have used quarterly returns for this analysis to reduce the higher share market volatility one sometimes sees when using daily, weekly or monthly returns.

 (Click to enlarge)
Figure 49 also shows that depending on the period in which the optimisation is undertaken, one will tend to invest primarily in a single equities asset-class. That is, you never invest equally across Australian and international shares, as is the near universal practice amongst super funds today.
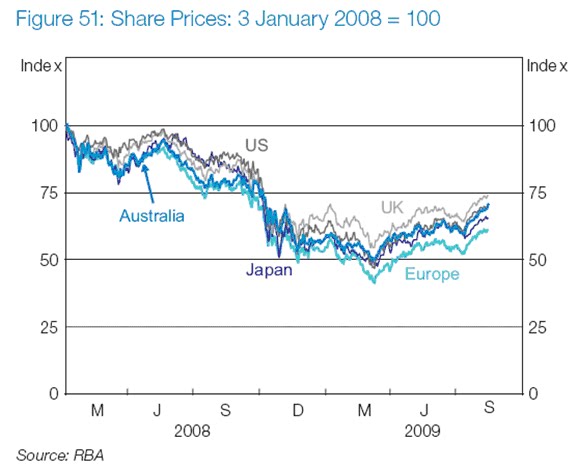
If one ignores industry convention, this makes perfect sense given that international equities, Australian equities and LPTs have all been highly correlated over the last 3 decades. But these very high 30 year correlations conceal an even less attractive investment characteristic: the correlations converge to close to one during periods of crisis, such as the 1987 stock market crash or the 2007-09 GFC. Figure 51 is a chart recently produced by the RBA that illustrates the performance of major equity markets over the last 2 years. Notwithstanding the significant economic differences between these countries, their listed equity markets behave as one.
 (Click to enlarge)
 Consistent with our earlier analysis, these optimisations reinforce the message that no matter what time period one selects, the vast bulk of all your capital is still allocated to fixed income securities even if you are targeting a very high long-term return of CPI + 6.5 per cent. It is worthwhile pointing out here that we have used a limited range of fixed income assets—namely bank bills and government debt—and would conjecture that the results would look even more unfavourable for equities if we included corporate bonds, RMBS and CMBS.
Interestingly, the analysis shows that bank bills and government debt are complementary investments and not necessarily substitutes, as we see, for instance, with equities. Observe in Figure 49 how there are significant allocations made to both cash (light blue bars) and government debt (dark blue bars) irrespective of the period.
Ironically given their demonstrably superior risk-adjusted return characteristics, fixed income investments also have dramatically lower access costs (ie, management fees and performance fees) than equities securities and related asset-classes such as hedge funds and private equity (both of which are also highly correlated with equities notwithstanding the rhetoric of managers seeking to raise money in these sectors).
The purpose of all of this analysis is simply to demonstrate that based on three decades of available empirical data, asset-allocation strategies in the super fund sector could be improved. And these findings hold very firmly over a wide variety different time periods.
As we have noted before, there are nevertheless many super funds that are doing a fantastic job of managing their members’ money. Our analysis has the most serious ramifications for retail super funds, which have the highest listed equities exposures.
The key message is just that members deserve much more discussion and debate around how funds are arriving at these decisions, which in many instances do not appear to be supported by empirical experience. At the very least, a transparent assessment of these actions will help funds deliver members better future outcomes.
*This article derives from the October edition of the RP Data-Rismark Monthly. To subscribe to the RP Data-Rismark Monthly, please click here.